lab
This procedure is part of a lab that teaches you how to monitor your Kubernetes cluster with Pixie.
Each procedure in the lab builds upon the last, so make sure you've completed the last procedure, Set up your TinyHat environment, before starting this one.
Your website, TinyHat.me, runs in Kubernetes. While Pixie helps you monitor your cluster and find the source of problems that arise within it, it's helpful to know about your cluster's structure and the components that make it up before learning how to use Pixie.
View your pods:
$kubectl get podsNAME READY STATUS RESTARTS AGEadd-service-5487c78c86-rsx2n 1/1 Running 0 10madmin-service-7cdcb754c9-blwpf 1/1 Running 0 10mfetch-service-68d9876b8b-2tb45 1/1 Running 5 10mfrontend-service-649f75984b-xdgtg 1/1 Running 0 10mgateway-service-6bcb8bc8d5-hwxcl 1/1 Running 0 10mmanipulation-service-75c4454b5d-687tf 1/1 Running 0 10mmoderate-service-55985878d-td2tl 1/1 Running 0 10mmysql-576f9d87d9-45cc4 1/1 Running 0 10msimulator-554c8577-5nn52 1/1 Running 0 10mupload-service-7f68c55ddc-d5kd5 1/1 Running 0 10mImportant
Every pod should be running by now, but if one isn't, give it few more minutes.
Here, you see nine containerized services and one simulator, each with their own pod. Instead of going into detail about the services now, you'll learn about them in context as you walk through this lab's scenarios. The simulator generates load to your website so you don't have to.
View your services next:
$kubectl get servicesNAME TYPE CLUSTER-IP EXTERNAL-IP PORT(S) AGEadd-service ClusterIP 10.108.136.0 <none> 80/TCP 13madmin-service ClusterIP 10.108.79.227 <none> 80/TCP 13mfetch-service ClusterIP 10.97.60.129 <none> 80/TCP 13mfrontend-service LoadBalancer 10.106.184.90 10.106.184.90 80:32327/TCP 13mgateway-service LoadBalancer 10.108.122.133 10.108.122.133 80:30691/TCP 13mkubernetes ClusterIP 10.96.0.1 <none> 443/TCP 15mmanipulation-service ClusterIP 10.102.93.91 <none> 80/TCP 13mmoderate-service ClusterIP 10.107.191.29 <none> 80/TCP 13mmysql ClusterIP 10.96.37.225 <none> 3306/TCP 13mupload-service ClusterIP 10.96.216.177 <none> 80/TCP 13mHere, you see your Kubernetes services. Notice that most of your app services have a corresponding Kubernetes service. One of these services is particularly important: frontend-service. This is a LoadBalancer that you connect to when you view your site.
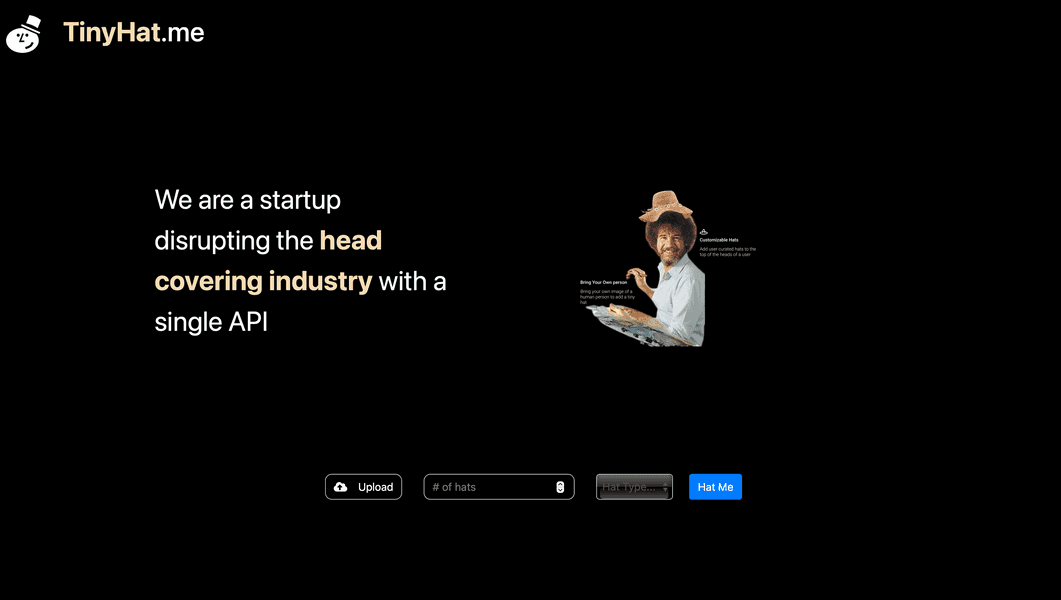
Speaking of viewing your site, do that now by opening the EXTERNAL-IP that you see for frontend-service in your browser:

Important
If the frontend service's External-IP is pending, you probably forgot to minikube tunnel -p minikube-pixie-lab in another window.
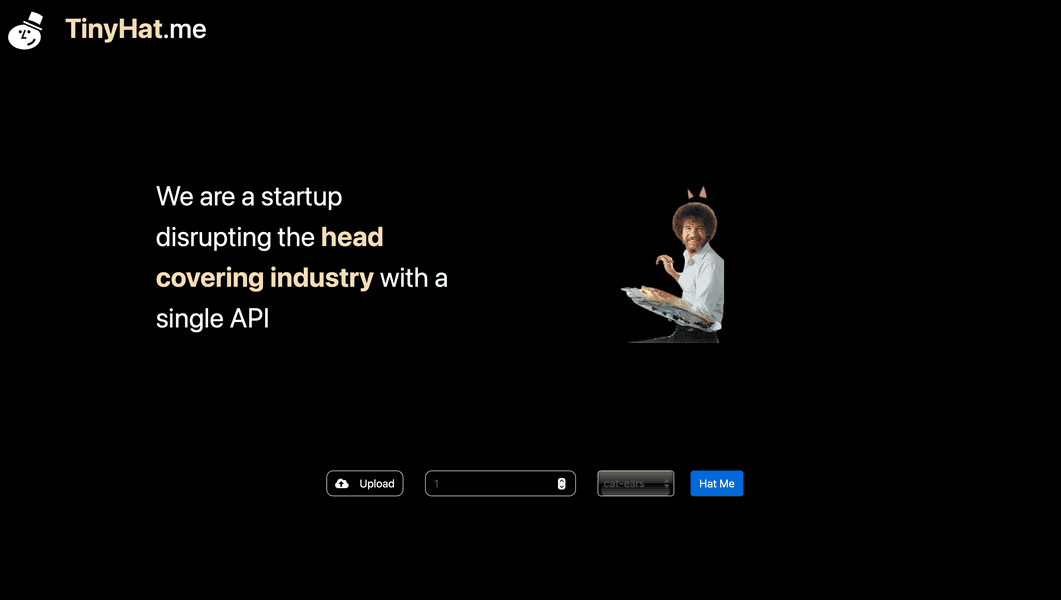
Select a number of hats to display and a hat type. Then, select Hat Me:

Now Bob Ross is wearing the hat(s) that you selected. Cool, right?
With a better understanding of your cluster's resources and your website, you're better prepared to install Pixie and use it to monitor and debug your application when problems arise.
lab
This procedure is part of a course that teaches you how to monitor your Kubernetes cluster with Pixie. Now that you've explored your cluster, instrument it with Pixie.