Add your custom visualization to a new or existing dashboard, programmatically, with New Relic's GraphQL API, NerdGraph.
Before you begin
If you haven't already:
- Sign up for a New Relic account
- Install Node.js
- Complete the first four steps in the
nr1quick start to install and configure the CLI
Create and publish your Nerdpack
Create a Nerdpack with a visualization. You'll add this visualization to a dashboard using NerdGraph.
Further reading
Because this guide is about using visualizations, not creating and publishing them, it breezes over these topics. If you're unfamiliar with visualizations or would like a thorough explanation of dealing with visualization Nerdpacks, check out the following resources:
If you already have a visualization you'd like to add to a dashboard, you can skip this section. But don't forget to make the necessary code adjustments to reference your visualization instead of the one this guide uses, called my-awesome-visualization.
Update your nr1 CLI:
$nr1 updateNow, you have the latest version.
Create a visualization, called my-awesome-visualization, in a Nerdpack, called my-awesome-nerdpack:
$nr1 create -t visualization -n my-awesome-visualization✔ You’re trying to create a visualization outside of a Nerdpack. We’ll create a Nerdpack for you—what do you want to name it? … my-awesome-nerdpack✔ nerdpack created successfully!nerdpack my-awesome-nerdpack is available at "./my-awesome-nerdpack"✔ visualization created successfully!visualization my-awesome-visualization is available at "./my-awesome-nerdpack/visualizations/my-awesome-visualization"When you build a visualization with nr1 create, you get a default visualization. You'll use this default visualization throughout this course.
Navigate to your new Nerdpack:
$cd my-awesome-nerdpackFrom here, you can run nr1 nerdpack commands.
Publish and subscribe to your Nerdpack:
$nr1 nerdpack:publish$nr1 nerdpack:subscribeNow, that your account is subscribed to your visualization, you can describe your app configurations with JSON and add it to a dashboard with NerdGraph.
Describe your visualization options with JSON
Whether you're adding your visualization to a new dashboard or an existing one, you need to send your configuration to NerdGraph.
Your custom visualization JSON object represents a dashboard widget and consists of the following fields:
| Field | Type | Description |
|---|---|---|
title | String | Title for your dashboard widget |
visualization | JSON | The metadata for your visualization |
visualization.id | String | Your visualization's ID |
rawConfiguration | JSON | A full configuration of your widget |
Tip
You can also add other types of widgets to dashboards with the steps in this guide, but the fields described here are specific to custom visualization widgets. For other widget types, you need to supply different data.
Explore the API on your own with our NerdGraph explorer!
Start with a JSON template based on the fields you need to describe your custom visualization:
{ "title": "", "visualization": { "id": "" }, "rawConfiguration": {}}Give your visualization widget a title:
{ "title": "My Awesome Visualization", "visualization": { "id": "" }, "rawConfiguration": {}}Look up your Nerdpack ID from my-awesome-nerdpack/nr1.json:
{ "schemaType": "NERDPACK", "id": "ab123c45-678d-9012-efg3-45hi6jkl7890", "displayName": "MyAwesomeNerdpack", "description": "Nerdpack my-awesome-nerdpack"}Then, look up your visualization ID from my-awesome-nerdpack/visualizations/my-awesome-visualization/nr1.json:
{ "schemaType": "VISUALIZATION", "id": "my-awesome-visualization", "displayName": "MyAwesomeVisualization", "description": "", "configuration": [ { "name": "nrqlQueries", "title": "NRQL Queries", "type": "collection", "items": [ { "name": "accountId", "title": "Account ID", "description": "Account ID to be associated with the query", "type": "account-id" }, { "name": "query", "title": "Query", "description": "NRQL query for visualization", "type": "nrql" } ] }, { "name": "fill", "title": "Fill color", "description": "A fill color to override the default fill color", "type": "string" }, { "name": "stroke", "title": "Stroke color", "description": "A stroke color to override the default stroke color", "type": "string" } ]}Set your visualization widget's visualization.id to the form {NERDPACK-ID}.{VISUALIZATION-ID}:
{ "title": "My Awesome Visualization", "visualization": { "id": "ab123c45-678d-9012-efg3-45hi6jkl7890.my-awesome-visualization" }, "rawConfiguration": {}}In my-awesome-nerdpack/visualizations/my-awesome-visualization/nr1.json, review your configuration options:
{ "schemaType": "VISUALIZATION", "id": "my-awesome-visualization", "displayName": "MyAwesomeVisualization", "description": "", "configuration": [ { "name": "nrqlQueries", "title": "NRQL Queries", "type": "collection", "items": [ { "name": "accountId", "title": "Account ID", "description": "Account ID to be associated with the query", "type": "account-id" }, { "name": "query", "title": "Query", "description": "NRQL query for visualization", "type": "nrql" } ] }, { "name": "fill", "title": "Fill color", "description": "A fill color to override the default fill color", "type": "string" }, { "name": "stroke", "title": "Stroke color", "description": "A stroke color to override the default stroke color", "type": "string" } ]}The name fields in configuration are important for describing your visualization widget.
Using the name field for every configuration object in your visualization's nr1.json file, build a rawConfiguration for your widget:
{ "title": "My Awesome Visualization", "visualization": { "id": "ab123c45-678d-9012-efg3-45hi6jkl7890.my-awesome-visualization" }, "rawConfiguration": { "nrqlQueries": [ { "accountId": 1234567, "query": "FROM NrUsage SELECT sum(usage) FACET metric SINCE 1 week ago" } ], "fill": "pink", "stroke": "green" }}Here, you've created a rawConfiguration by supplying values for each configuration option in nr1.json. Note that nrqlQueries is an array because its type is collection. The other values are strings. Learn more about these configuration options in Configure your custom visualization.
Now that you've described your visualization widget in JSON, you can add your configured visualization to a dashboard. In the next section, you'll learn how to create a new dashboard with your visualization. If you already have one ready, skip ahead to add your visualization to your existing dashboard.
Create a new dashboard with your visualization
If you want to create a new dashboard for your visualization widget, use NerdGraph's dashboardCreate() mutation.
The NerdGraph dashboardCreate() mutation takes the following fields:
| Field | Type | Description |
|---|---|---|
accountId | Integer | The ID for the account for which you want to create your dashboard |
dashboard | JSON | The details of the dashboard you're creating |
dashboard.name | String | The name of your dashboard |
dashboard.permissions | Enum: PRIVATE, PUBLIC_READ_ONLY, PUBLIC_READ_WRITE | The access control of your dashboard |
dashboard.pages | Array: JSON | The details of your dashboard's pages |
dashboard.pages[].name | String | The name of the dashboard page |
dashboard.pages[].widgets | Array: JSON | The widgets to add to the dashboard page |
Tip
You can also pass more fields to dashboardCreate() to add details, widgets, and more. Explore the API on your own with our NerdGraph explorer!
In this guide, you create a dashboard with a single page that contains a single widget—the visualization widget you described in the last section.
Build out a GraphQL mutation template based on the fields you need to describe your dashboard in dashboardCreate():
mutation { dashboardCreate( accountId: 0, dashboard: { name: "", pages: [ { name: "", widgets: [] }, ], permissions: PRIVATE } )}Here, you've defined the template for a private dashboard. Now, it's time to fill in the details.
Look up your account ID and enter it for your accountId:
mutation { dashboardCreate( accountId: 1234567, dashboard: { name: "", pages: [ { name: "", widgets: [] }, ], permissions: PRIVATE } )}Select a name for your dashboard and its page:
mutation { dashboardCreate( accountId: 1234567, dashboard: { name: "My Awesome Dashboard", pages: [ { name: "One Page to Rule Them All", widgets: [] }, ], permissions: PRIVATE } )}In widgets, place the widget object you created in the last section:
mutation { dashboardCreate( accountId: 1234567, dashboard: { name: "My Awesome Dashboard", pages: [ { name: "One Page to Rule Them All", widgets: [ { title: "My Awesome Visualization", visualization: { id: "ab123c45-678d-9012-efg3-45hi6jkl7890.my-awesome-visualization" }, rawConfiguration: { nrqlQueries: [ { accountId: 1234567, query: "FROM NrUsage SELECT sum(usage) FACET metric SINCE 1 week ago" } ], fill: "pink", stroke: "green" } } ] }, ], permissions: PRIVATE } )}Finally, add the return fields to your mutation:
mutation { dashboardCreate( accountId: 1234567, dashboard: { name: "My Awesome Dashboard", pages: [ { name: "One Page to Rule Them All", widgets: [ { title: "My Awesome Visualization", visualization: { id: "ab123c45-678d-9012-efg3-45hi6jkl7890.my-awesome-visualization" }, rawConfiguration: { nrqlQueries: [ { accountId: 1234567, query: "FROM NrUsage SELECT sum(usage) FACET metric SINCE 1 week ago" } ], fill: "pink", stroke: "green" } } ] }, ], permissions: PRIVATE } ) { entityResult { guid } }}Important
Make sure you replace the IDs in your mutation query with ones that match your account, Nerdpack, and visualization.
Now, you have a mutation ready to send to NerdGraph to create single-page dashboard with a widget for your custom visualization. As a result, you'll see the new dashboard's entity GUID.
In the next section, you'll learn how to add your visualization to an existing dashboard. If that's not relevant to your goals, skip ahead to send your request to NerdGraph.
Add your visualization to an existing dashboard
To add your visualization widget to an existing dashboard, use NerdGraph's dashboardAddWidgetsToPage() mutation.
The NerdGraph dashboardAddWidgetsToPage() mutation takes the following fields:
| Field | Type | Description |
|---|---|---|
guid | String | The entity GUID for the dashboard to which you're adding your widgets |
widgets | Array: JSON | The widgets to add to the dashboard page |
Tip
You can also pass more fields to dashboardAddWidgetsToPage() to add details, widgets, and more. Explore the API on your own with our NerdGraph explorer!
Build out a GraphQL mutation template based on the fields you need to describe your dashboard in dashboardAddWidgetsToPage():
mutation { dashboardAddWidgetsToPage( guid: "" widgets: [] ) { errors { description } }}Look up your dashboard's GUID and enter it for guid:
mutation { dashboardAddWidgetsToPage( guid: "AbCdEFghIJkLMNo1PQRSTUVWXYZAbCD2Ef34GHI" widgets: [] ) { errors { description } }}In widgets, place the widget object you created in Describe your visualization options with JSON:
mutation { dashboardAddWidgetsToPage( guid: "AbCdEFghIJkLMNo1PQRSTUVWXYZAbCD2Ef34GHI" widgets: [ { visualization: { id: "ab123c45-678d-9012-efg3-45hi6jkl7890.my-awesome-visualization" }, rawConfiguration: { nrqlQueries: [ { accountId: 1234567, query: "FROM NrUsage SELECT sum(usage) FACET metric SINCE 1 week ago" } ], fill: "pink", stroke: "green" } }, ] )}Finally, add the return fields to your mutation:
mutation { dashboardAddWidgetsToPage( guid: "AbCdEFghIJkLMNo1PQRSTUVWXYZAbCD2Ef34GHI" widgets: [ { visualization: { id: "ab123c45-678d-9012-efg3-45hi6jkl7890.my-awesome-visualization" }, rawConfiguration: { nrqlQueries: [ { accountId: 1234567, query: "FROM NrUsage SELECT sum(usage) FACET metric SINCE 1 week ago" } ], fill: "pink", stroke: "green" } }, ] ) { errors { description } }}Now, you have a mutation ready to send to NerdGraph to add your custom visualization to an existing dashboard. As a result, you'll see descriptions of any thrown errors to help you debug issues.
The last thing you need to do is actually send your request to NerdGraph.
Send your request to NerdGraph
Send an HTTP request to NerdGraph with the payload you built in previous sections for the mutation that best suits your needs. There are many tools you can use to send an HTTP request, but in this guide, you learn how to communicate with NerdGraph using three specific tools:
If you use another, you can adapt these methods for your favorite development tool.
NerdGraph API explorer
The NerdGraph API explorer is an implementation of GraphiQL that lets you explore the NerdGraph APIs.
Go to the NerdGraph API explorer.
Select or create a new API key:
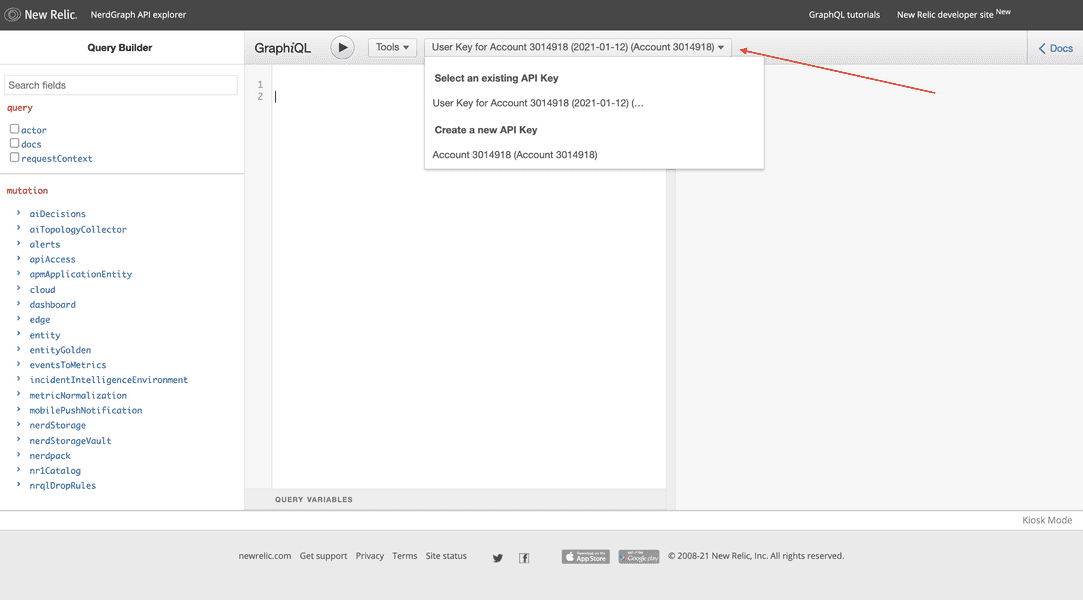
In the center console, paste your mutation query:
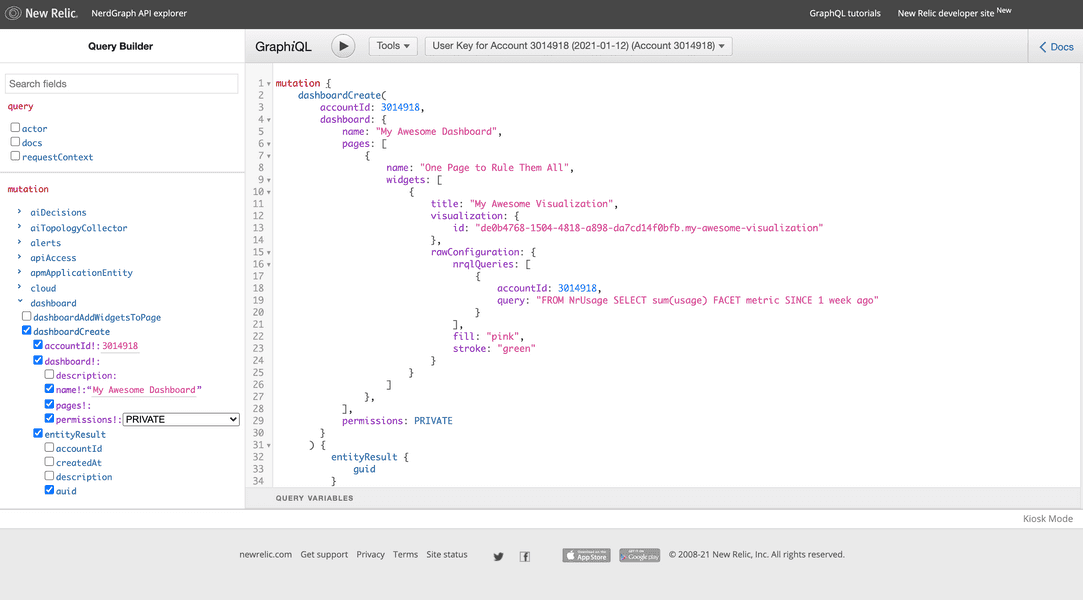
Important
Make sure you replace the IDs in your mutation query with ones that match your account, Nerdpack, and visualization.
Press Execute Query and see the results in the right pane:
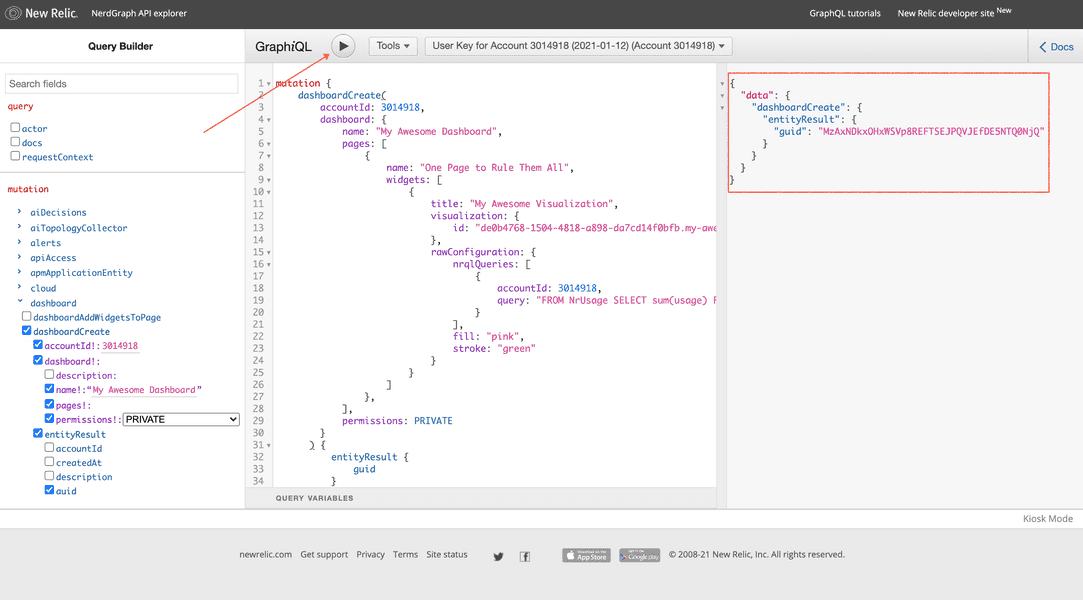
If you successfully created a new dashboard, your response has an entity GUID. If you don't have an entity GUID, the response contains error messages to help you debug your query.
If you added your visualization to an existing dashboard, you won't see errors in the response. If you do see error messages, use them to debug your query.
Explore
The NerdGraph API explorer lets you see other fields and change your query without typing everything manually. Use the left pane to explore NerdGraph.
cURL
cURL is a command line utility for making HTTP requests.
Select or create a New Relic user key. Copy this key, because you use it in the next step.
Make a request to NerdGraph, using cURL:
$curl https://api.newrelic.com/graphql \> -H 'Content-Type: application/json' \> -H 'API-Key: <YOUR-USER-KEY>' \> --data-binary '{"query": "mutation {dashboardCreate(dashboard: {name: \"My Awesome Dashboard\", pages: [{name: \"One Page to Rule Them All\", widgets: [{title: \"My Awesome Visualization\", visualization: {id: \"ab123c45-678d-9012-efg3-45hi6jkl7890.my-awesome-visualization\"}, rawConfiguration: {nrqlQueries: [{accountId: 3014918, query: \"FROM NrUsage SELECT sum(usage) FACET metric SINCE 1 week ago\"}], fill: \"pink\", stroke: \"green\"}}]}], permissions: PRIVATE}, accountId: <YOUR-ACCOUNT-ID>) { entityResult { guid }}}", "variables": ""}'Important
Make sure you replace the IDs in your mutation query with ones that match your account, Nerdpack, and visualization.
Here, you send a request to NerdGraph that has two headers, Content-Type and API-Key, and a binary message body containing one of the mutation queries you built in previous sections.
If you prefer to use a UI-based client, like Postman, you can adapt this method to a format that your client supports.
New Relic CLI
The newrelic is a command line interface for reading and writing New Relic data.
If you haven't already, install newrelic by following the first two steps of our Get started with the New Relic CLI guide.
Once you've done that, you will have newrelic installed and configured for making NerdGraph requests.
Make a NerdGraph request using newrelic nerdgraph query:
$newrelic nerdgraph query 'mutation {$ dashboardCreate($ accountId: 1234567,$ dashboard: {$ name: "My Awesome Dashboard",$ pages: [$ {$ name: "One Page to Rule Them All",$ widgets: [$ {$ title: "My Awesome Visualization",$ visualization: {$ id: "de0b4768-1504-4818-a898-da7cd14f0bfb.my-awesome-visualization"$ },$ rawConfiguration: {$ nrqlQueries: [$ {$ accountId: <YOUR-ACCOUNT-ID>,$ query: "FROM NrUsage SELECT sum(usage) FACET metric SINCE 1 week ago"$ }$ ],$ fill: "pink",$ stroke: "green"$ }$ }$ ]$ },$ ],$ permissions: PRIVATE$ }$ ) {$ entityResult {$ guid$ }$ }$}'Important
Make sure you replace the IDs in your mutation query with ones that match your account, Nerdpack, and visualization.
View your new dashboard
Now that you've built a dashboard with NerdGraph, it's time to check your work!
Go to New Relic.
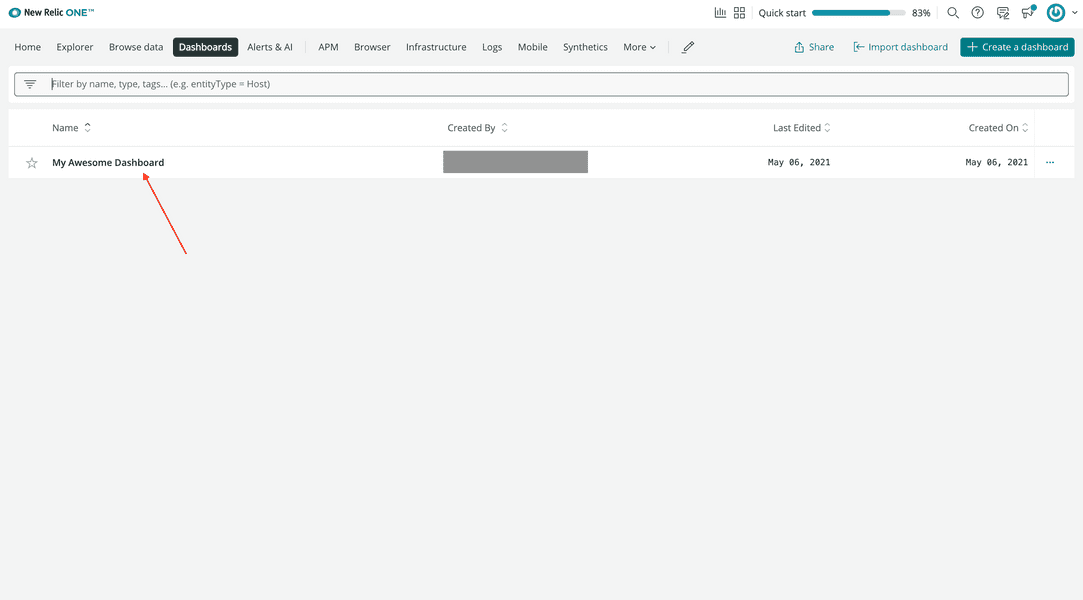
Navigate to Dashboards:
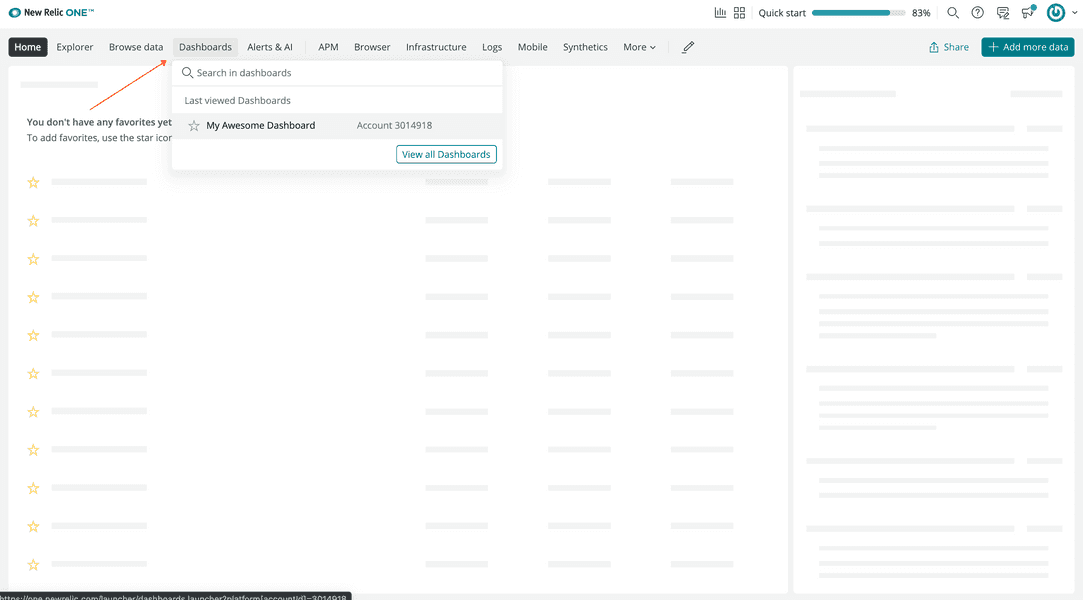
Select your new dashboard:
View your dashboard:
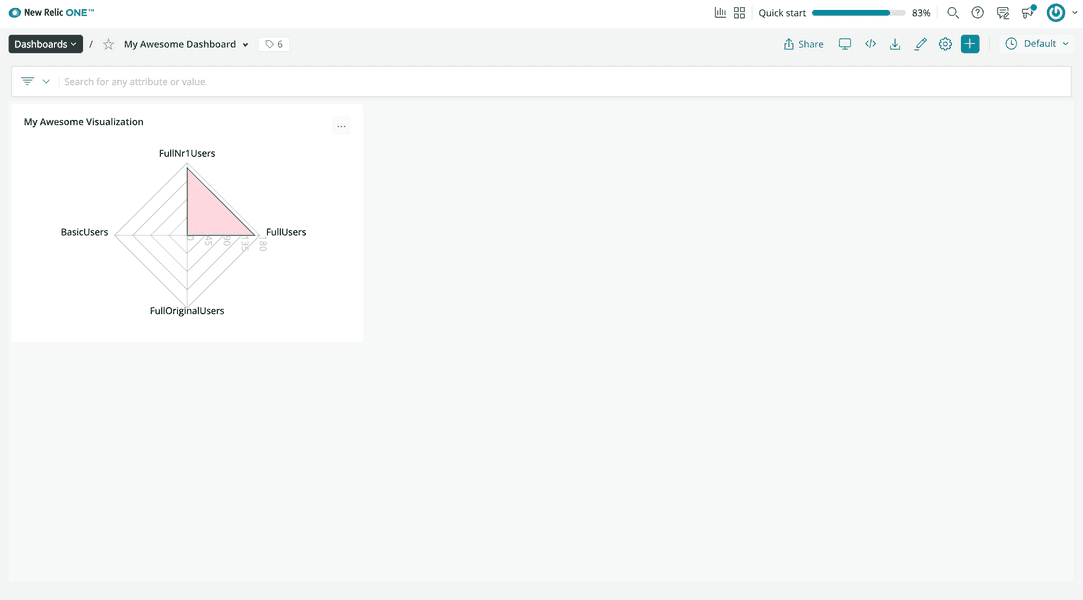
The dashboard you created has the name you passed in your mutation, "My Awesome Dashboard". It also has the configuration you sent in rawConfiguration, from the NRQL data query to the fill and stroke colors.
Summary
Congratulations! In this guide, you used NerdGraph, New Relic's GraphQL API, to add your custom visualization to a dashboard.